To put in context the need to generate a standard curve or standard curve , it should be remembered that the ELISA technique is an immunoassay that is carried out in order to determine the presence and / or concentration of a certain protein in a sample of liquid nature.
When an ELISA immunoassay is performed , three types of results can be obtained:
Using the ELISA immunoassay we can determine if the target protein is present in the test sample, comparing it with a negative control.
In order to determine the relative amount of target protein between different samples, these can be compared taking into account that the concentration of target protein in them will be proportional to the intensity of the signal they generate.
The preparation of the standard curve in this case is a critical step to obtain accurate quantitative data.
This method is based on the proportionality that exists between the absorbance values of a certain sample and the concentration of target protein present in it.
ELISA assays can also accurately determine the target protein concentration in a given sample. For this, it is necessary to previously prepare a standard curve or standard curve with known concentrations of the target protein, using dilutions prepared from the purified antigen.
In this entry we summarize the steps to follow for the correct performance of a standard curve or standard curve to carry out a quantitative ELISA immunoassay .
The standard curve must be prepared each time an experiment is carried out, and for each plate independently, since there are factors such as temperature, incubation time, pipetting, etc. which can directly affect the results.
1.- Choose the standard
The standard curve is constructed from a series of samples with a known quantity of descending antigen, for which it is usual to start with purified antigen.
The commercial ELISA kits usually include this standard as a component of the kit itself.
In other cases, the purified protein can be purchased or purified in its recombinant form in the laboratory.
2.- Select the range of the standard curve
The amounts of protein that are usually detected by ELISA depend on each antigen-antibody reaction, although they are often less than 0.1ng.
Curves in the range of 0 to 1000pg / mL are usually constructed, although this can be expanded in the case that you are working with concentrated samples.
3.- Serial dilutions
For the preparation of the standard curve or standard curve, it is necessary to make serial dilutions from the antigen that will be used as standard. The range of concentrations to be prepared should be close to the expected concentration of the test sample.
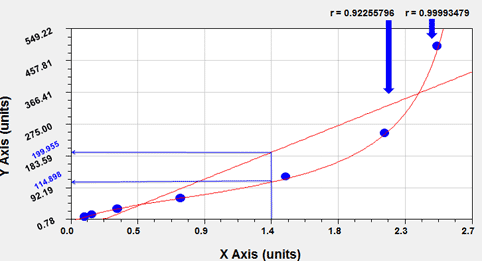
Dilutions are run in duplicate or triplicate, and after reading the absorbance of each of the wells, the mean of each is calculated for each dilution. These absorbance values will be plotted on a graph (Y axis) against the known antigen concentrations obtained from serial dilutions (X axis).
Once the standard curve is obtained, the concentration of the test sample is calculated by extrapolating its absorbance in said graph. Many ELISA plate readers incorporate programs that automatically generate the standard curve, although it is also common to use programs such as excel or the like.
Finally, in the event that the sample has an absorbance value that falls outside the range of the standard curve, it must be diluted before reading it. The concentration obtained from the standard curve in these cases must then be multiplied by the corresponding dilution factor.